Send your RDS logs to SigNoz
Overview
This documentation provides a detailed walkthrough on how to set up an AWS Lambda function to collect Relational Database Service (RDS) logs stored in an AWS S3 bucket and forward them to SigNoz. By the end of this guide, you will have a setup that automatically sends your RDS logs to SigNoz, enabling you to visualize and monitor your database performance and health.
Here’s a quick summary of what we’ll be doing in this detailed article.
- Creating / Configuring your S3 bucket
- Understanding how lambda function work
- Creating a lambda function
- The Lambda Function Code
- Visualize the logs in SigNoz
Prerequisites
- AWS account with administrative privilege.
- SigNoz Cloud Account
Before we dive into creating and configuring the S3 bucket and Lambda function, let's talk a little about AWS RDS () supported databases and all the expected types of logs that you will be dealing with.
Introduction to Database Logging in AWS RDS
Amazon Web Services (AWS) Relational Database Service (RDS) offers a managed database solution for various relational database engines, catering to the diverse needs of businesses and applications. AWS RDS supports several popular database engines, each offering its unique set of logging capabilities to monitor and troubleshoot database activities effectively.
Supported Database Engines
AWS RDS supports a wide range of relational database engines, including:
- PostgreSQL,
- Oracle,
- MySQL,
- MS SQL Server, and
- MariaDB.
Each of these database engines comes with its strengths and capabilities, tailored to specific use cases and requirements.
PostgreSQL:
PostgreSQL provides comprehensive logging capabilities covering various aspects of database operation. They include:
- Startup Logs
- Server Logs
- Query Logs
- Transaction Logs
- Connection Logs
- Error Logs
- Audit Logs
General header format for postgres logs:
{"timestamp", "user", "dbname", "pid", "remote_host", "remote_port", "session_id", "line_num", "ps", "session_start", "vxid", "txid", "error_severity", "state_code", "message", "detail", "hint", "internal_query", "internal_position", "context", "statement", "cursor_position", "func_name", "file_name", "file_line_num", "application_name", "backend_type", "leader_pid", "query_id"}
Sample log line:
2017-06-12 19:09:49 UTC:...:rds_test@postgres:[11701]:LOG: AUDIT: OBJECT,1,1,READ,SELECT,TABLE,public.t1,select * from t1;
Oracle:
Oracle databases offer several log types catering to different aspects of database management. They include:
- Alert Logs
- Audit Files
- Trace Files
- Listener Logs
- Management Agent
General header format for oracle DB logs:
{"TIME", "DATA", "MODULENAME", "DOMAIN", "LOGLEVEL", "LOGINID", "IPADDR", "LOGGEDBY", "HOSTNAME", "MESSAGEID", "CONTEXTID"}
MySQL:
MySQL databases support various log types to aid in monitoring and troubleshooting. They include:
- Error Log
- Slow Query Log
- General Query Log
- Audit Log
- Binary Log
- Relay Log
- DDL Log
Example error_log contents for MYSQL db:
{"LOGGED", "THREAD_ID", "PRIO", "ERROR_CODE", "SUBSYSTEM", "DATA"}
Sample Audit logs for MySQL:
 <AUDIT_RECORD>
  <TIMESTAMP>2019-10-03T14:09:38 UTC</TIMESTAMP>
  <RECORD_ID>6_2019-10-03T14:06:33</RECORD_ID>
  <NAME>Query</NAME>
  <CONNECTION_ID>5</CONNECTION_ID>
  <STATUS>0</STATUS>
  <STATUS_CODE>0</STATUS_CODE>
  <USER>root[root] @ localhost [127.0.0.1]</USER>
  <OS_LOGIN/>
  <HOST>localhost</HOST>
  <IP>127.0.0.1</IP>
  <COMMAND_CLASS>drop_table</COMMAND_CLASS>
  <SQLTEXT>DROP TABLE IF EXISTS t</SQLTEXT>
 </AUDIT_RECORD>
MS SQL Server:
MS SQL Server databases maintain several types of logs to facilitate monitoring and troubleshooting. They include:
- Error Logs
- Agent Logs
- Trace Files
- Dump Files
Audit Log header format:
{"action_id", "action_name", "additional_information", "affected_rows", "application_name", "audit_schema_version", "class_type", "class_type_desc", "client_ip", "connection_id", "data_sensitivity_information", "database_name", "database_principal_id", "database_principal_name", "duration_milliseconds", "event_time", "host_name", "is_column_permission", "is_server_level_audit", "object_id", "object_name", "obo_middle_tier_app_id", "permission_bitmask", "response_rows", "schema_name", "securable_class_type", "sequence_group_id", "sequence_number", "server_instance_name", "server_principal_id", "server_principal_name", "server_principal_sid", "session_id", "session_server_principal_name", "statement", "succeeded", "target_database_principal_id", "target_database_principal_name", "target_server_principal_id", "target_server_principal_name", "target_server_principal_sid", "transaction_id", "user_defined_event_id", "user_defined_information"}
MariaDB:
MariaDB databases offer logging capabilities covering error handling and query performance monitoring. They include:
- Error Log
- Slow Query Log
- General Log
Slow Query Log format:
{"start_time", "user_host", "query_time", "lock_time", "rows_sent", "rows_examined", "db", "last_insert_id", "insert_id", "server_id", "sql_text", "thread_id", "rows_affected"}
Error Log format: Until MariaDB 10.1.4, the format only consisted of the date (yymmdd) and time, followed by the type of error (Note, Warning, or Error) and the error message.
Sample error log:
2018-11-27 2:46:46 140278181563136 [Warning] mysqld: Disk is full writing '/var/lib/mariadb-bin.00001' (Errcode: 28 "No space left on device"). Waiting for someone to free space... (Expect up to 60 secs delay for server to continue after freeing disk space)
General Log format:
{"event_time", "user_host", "thread_id", "server_id", "command_type", "argument"}
The screenshots shown below were taken to send Elastic Load Balancer logs to SigNoz, rest assured, the steps for for RDS logs to SigNoz cloud endpoint remain same. Please name the appropriate name changes against what is shown below in the screenshots (e.g. - bucket names, name fields, etc)
Creating / Configuring your S3 bucket
To accomplish the task described, please follow these steps:
- Creating an S3 Bucket:
- Sign in to the AWS Management Console.
- Navigate to the Amazon S3 service.
- Click on Create bucket.
- Enter a unique bucket name, select the region, and configure any additional settings if needed (such as versioning, logging, etc.).
- Click Create bucket to finalize the creation process.
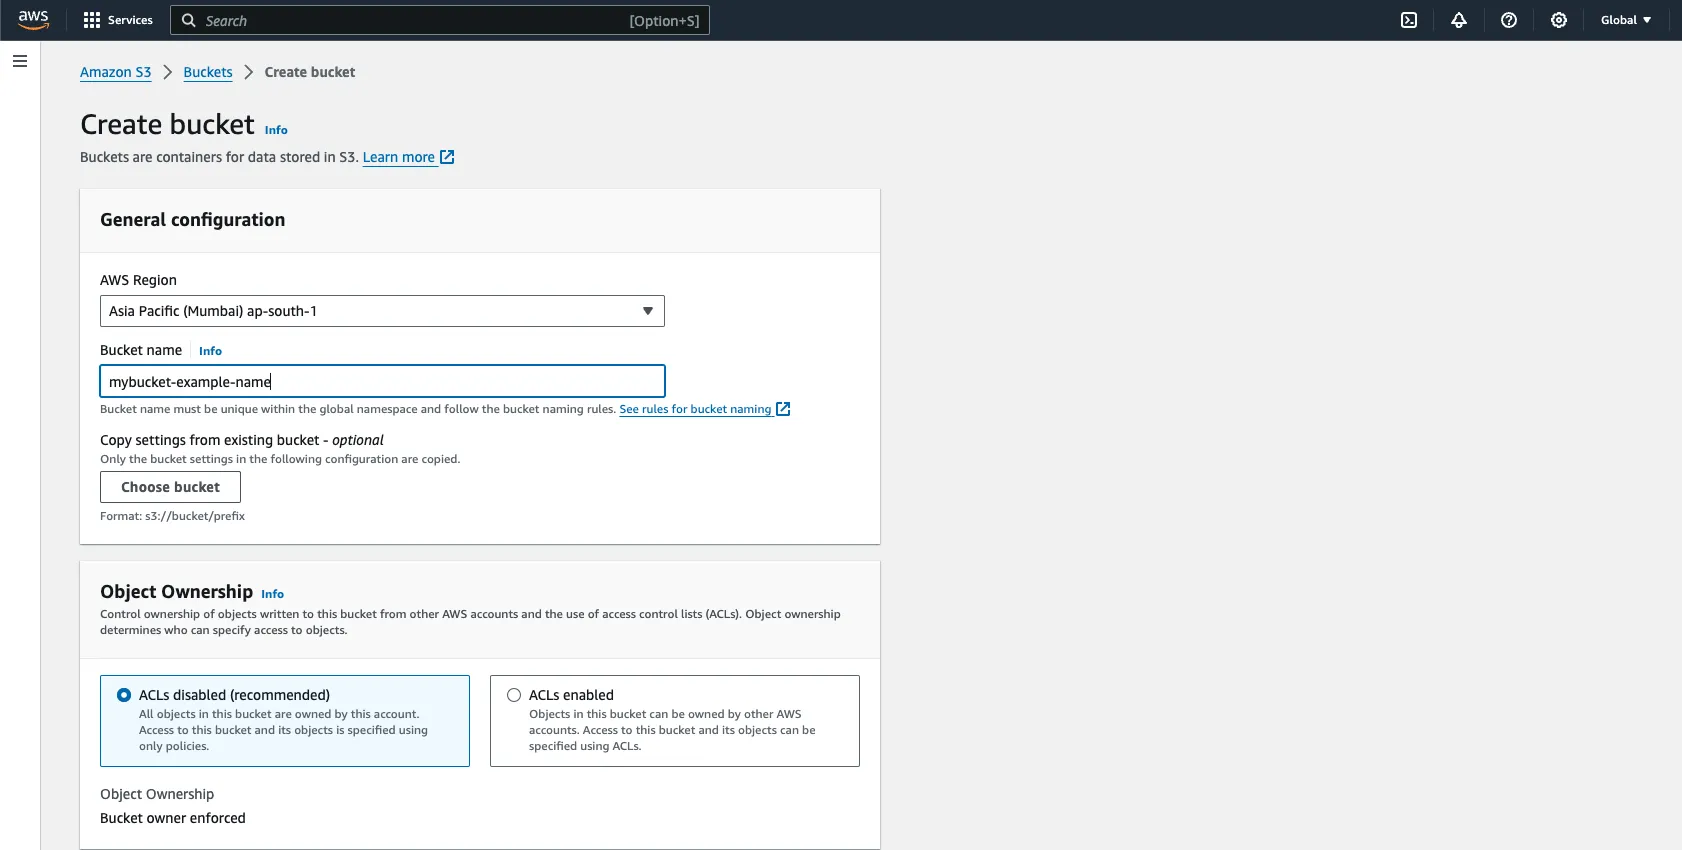
Uploading Data to the S3 Bucket:
- After creating the bucket, navigate to the S3 Management Console.
- Click on the Upload button.
- Select the files you wish to upload from your local machine.
- Optionally, configure settings like encryption, permissions, etc.
- Click Upload to upload the selected files to the bucket.
File Formats:
- You can upload files in various formats such as .json, .csv, .log, .gz, .zip, etc.
- If you have configured RDS logging, RDS logs for various DB's are either saved in
.gzip(compressed) format or any of the format mentioned in the previous point in your S3 bucket.
Please be advised that all logs will undergo conversion to JSON format before transmission. Consequently, it may be necessary to perform supplementary preprocessing of the logs as part of this conversion process. Here preprocessing of the logs means getting them from S3 bucket, separating each log line based on the delimiter ("," or based on quotes or whitespaces) and assigning them to respective keys. Thus making a key, value pair before sending to SigNoz.
To move forward, we assume that you already have some data in your S3 bucket.
For the scope of this documentation, we assume that all the data in S3 bucket is in the same format. For example, if one file is in .csv format, then all files within the bucket will be in .csv format. For files in different formats, you will have to use different parsing functions for each format or update the existing function accordingly.
The general header(table) format of all types of RDS logs are described above, in our code, we'll use the headers for which you wish to send the logs to SigNoz.
Note that these headers are just for name sake to represent the log row values, you can change them if you wish to, but it is not advisable.
Understanding how lambda function work
When you successfully attach your lambda function with the S3 bucket and configure it correctly, any new addition / deletion / copy / PUT etc, requests made to the S3 bucket will trigger the lambda function and the code written in the lambda function will get executed.
Creating a lambda function
Follow these steps to create the lambda function:
Step 1: Go to your AWS console and search for AWS Lambda, go to Functions and click on Create Function.

Step 2: Choose the Author from scratch checkbox and proceed to fill in the function name.
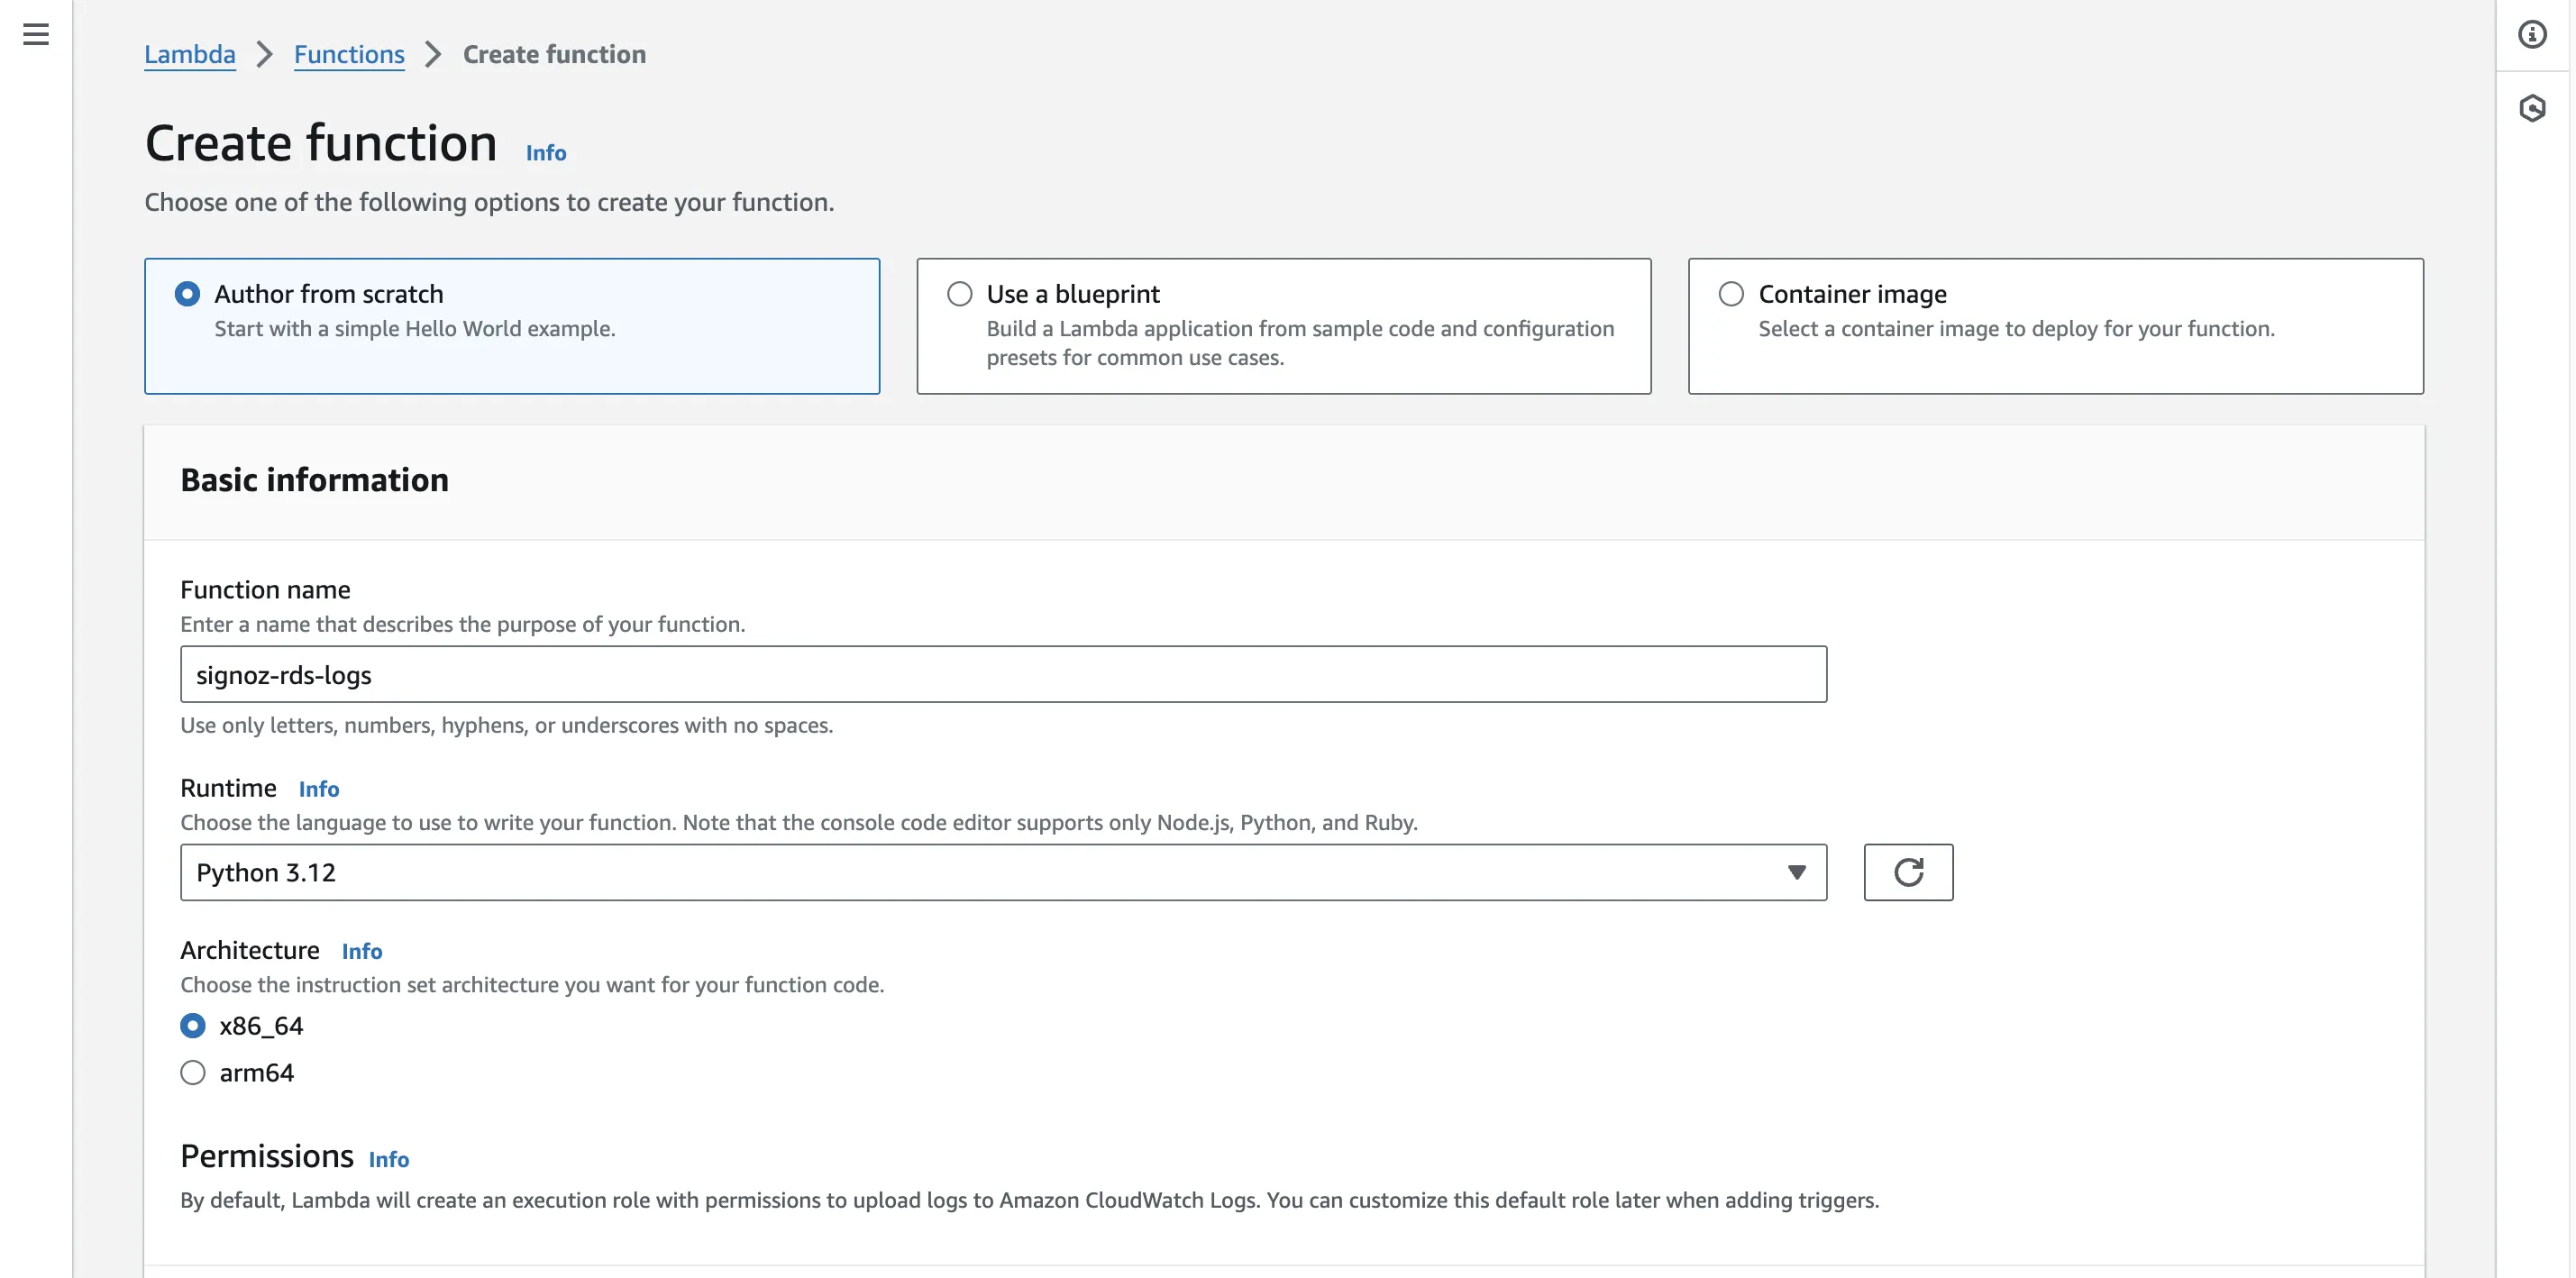
Step 3: Choose Python 3.x as the Runtime version, x86_64 as Architecture (preferably), and keep other settings as default. Select Create a new role with basic Lambda permissionsfor now, we’ll requiring more permissions down the lane. So for now, select this option.

Step 4: Once you are done configuring the lambda function, the function will get created.
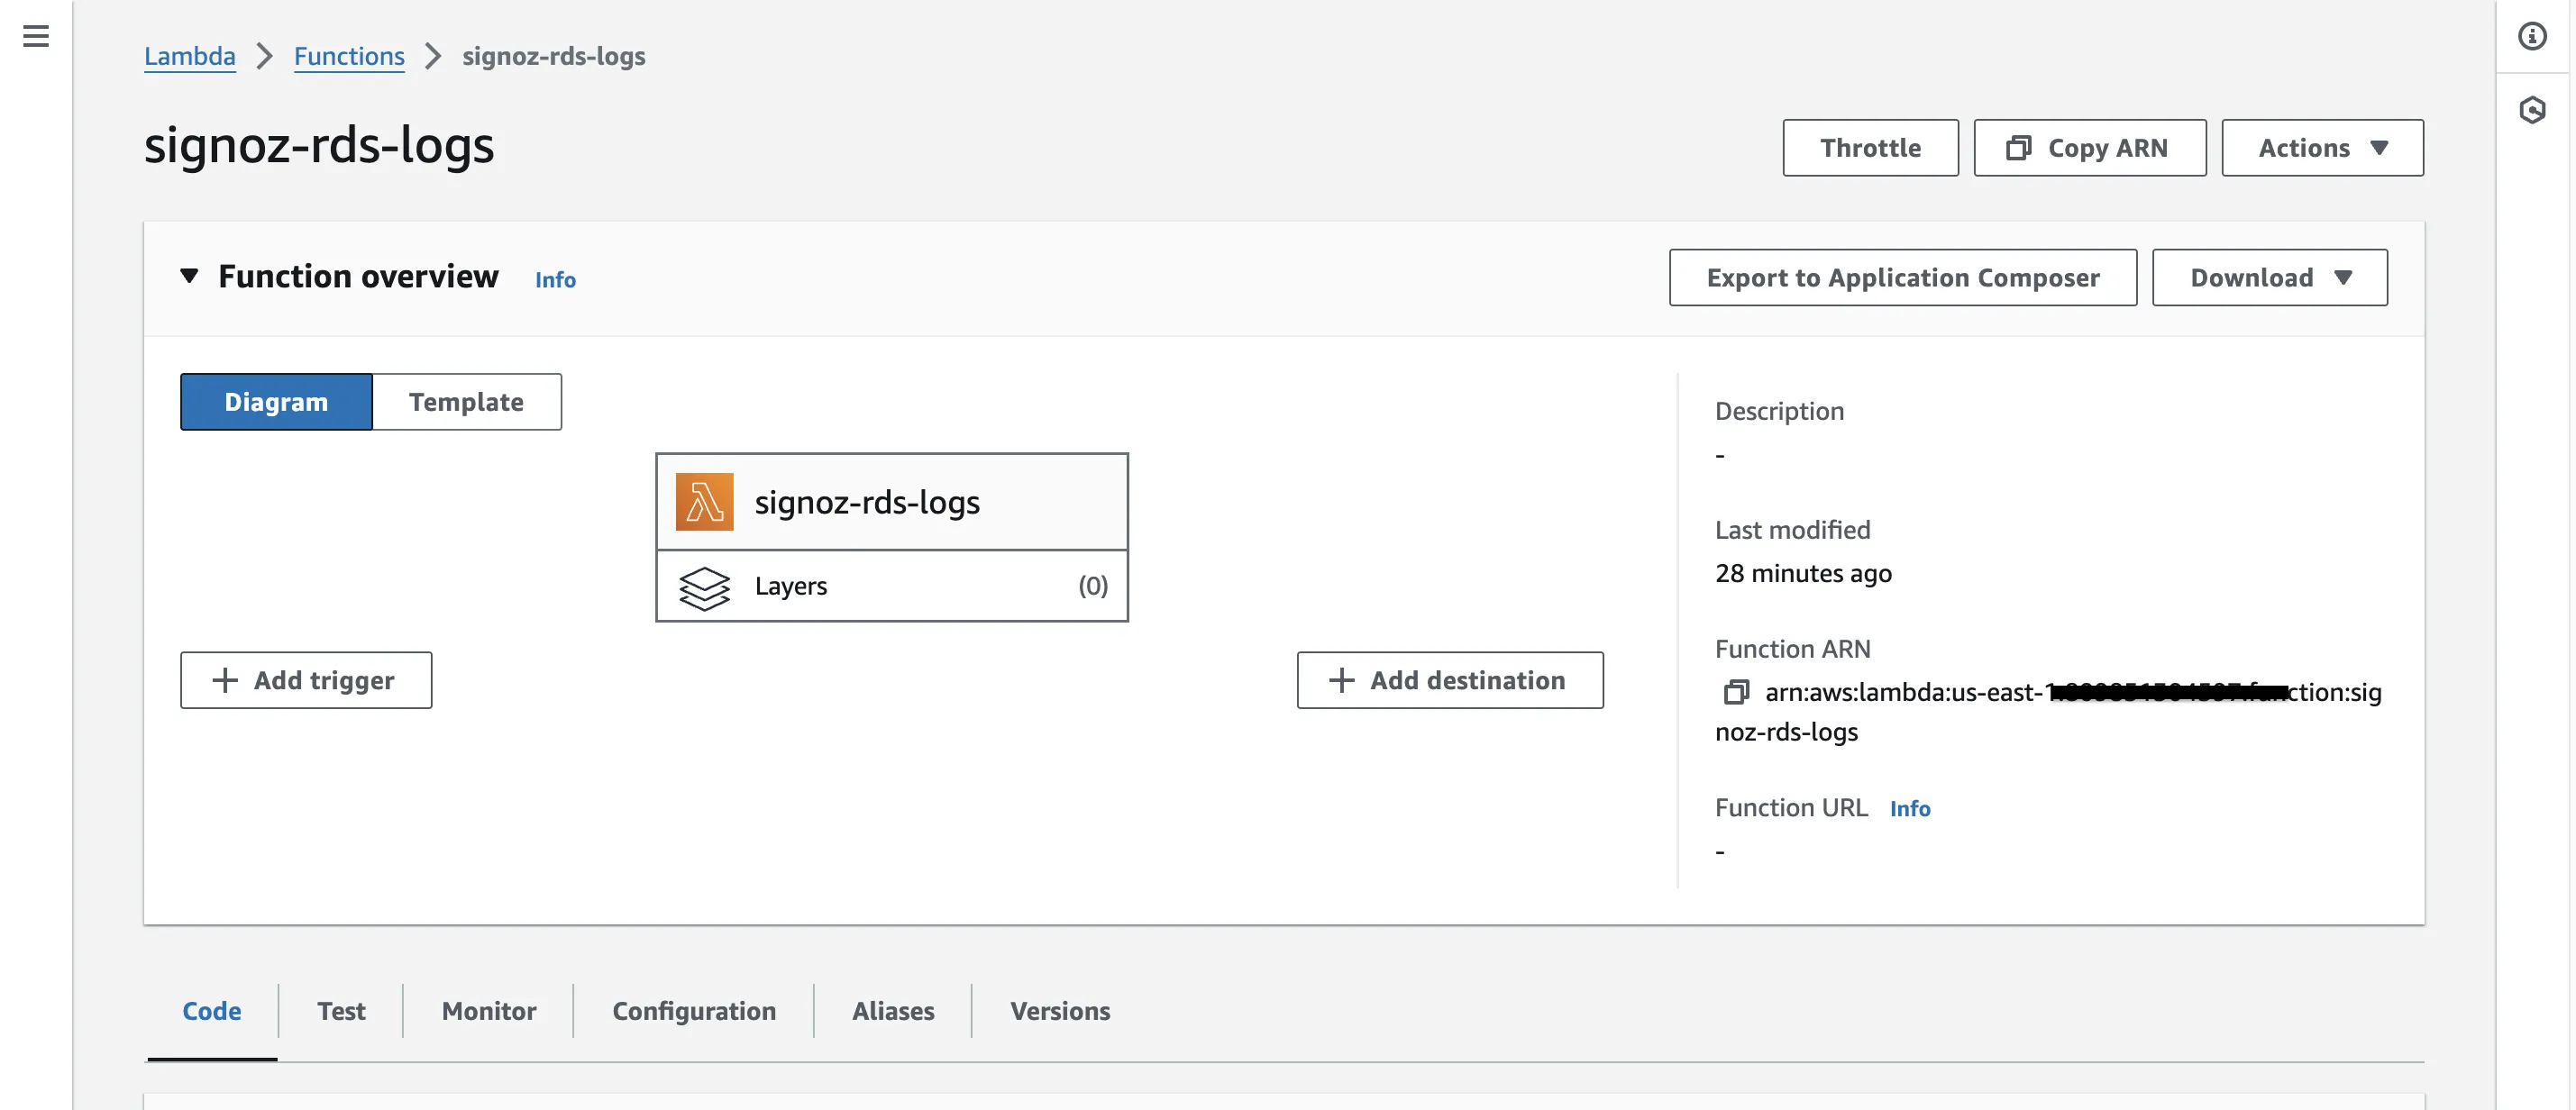
Configuring Policies for Lambda function
As said in Step 3 previously, we need extra permissions in order to access the S3 Bucket for execution of our Lambda code, follow along to set it up.
Step 1: Scroll down from your Lambda page, you’ll see a few tabs there. Go to Configurations and select Permissions from the left sidebar.
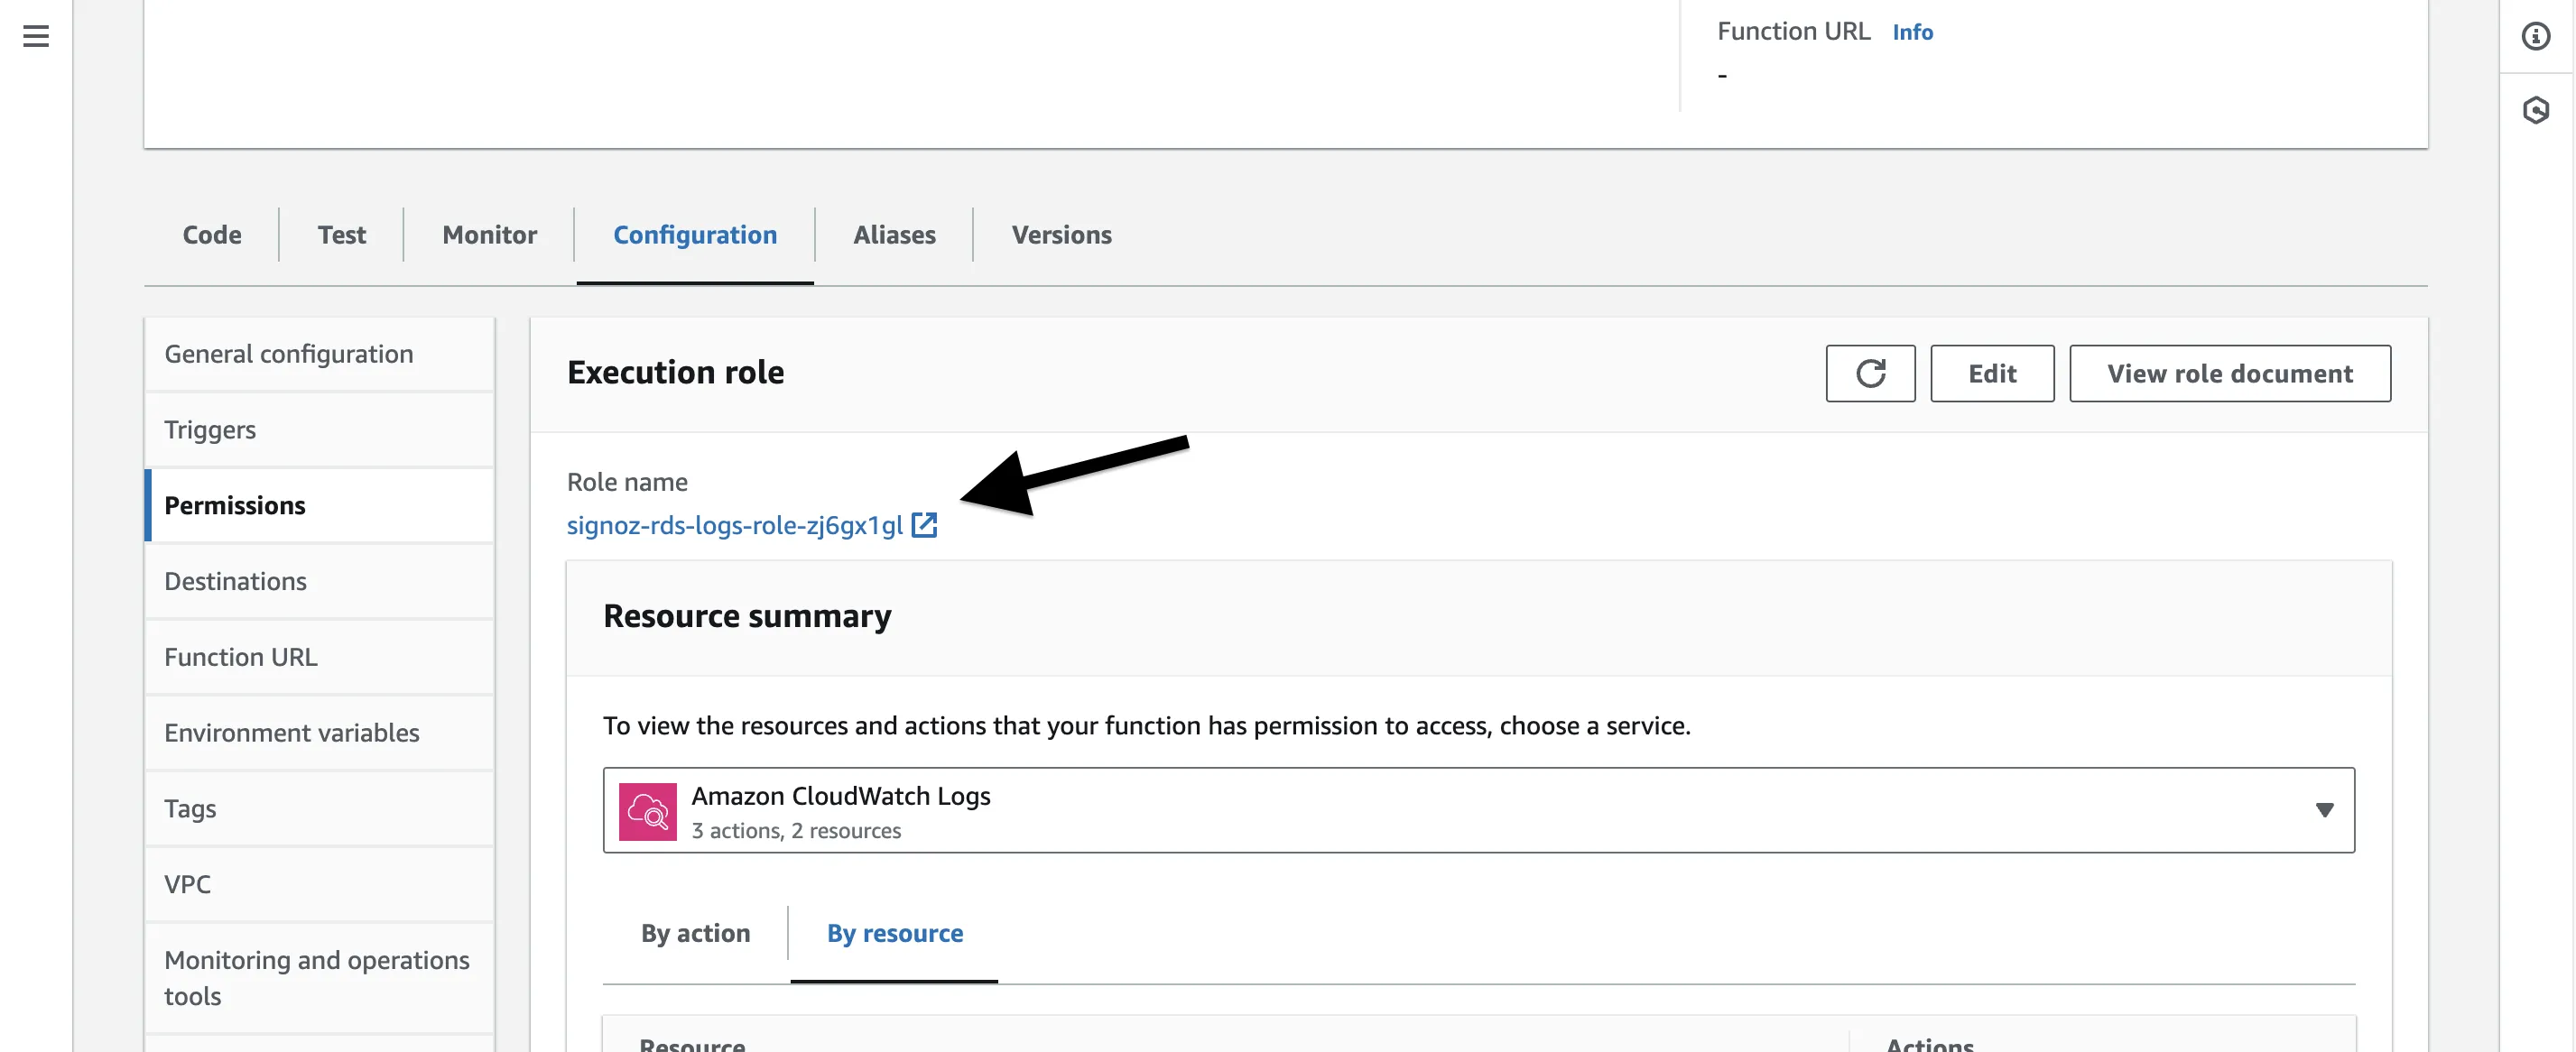
Step 2: Click on the Execution Role name link just under Role name, it will take us to AWS IAM page. Here we will add policies to get full S3 access. Once here, click on the Add permissions button and select Attach policies from the drop down list.
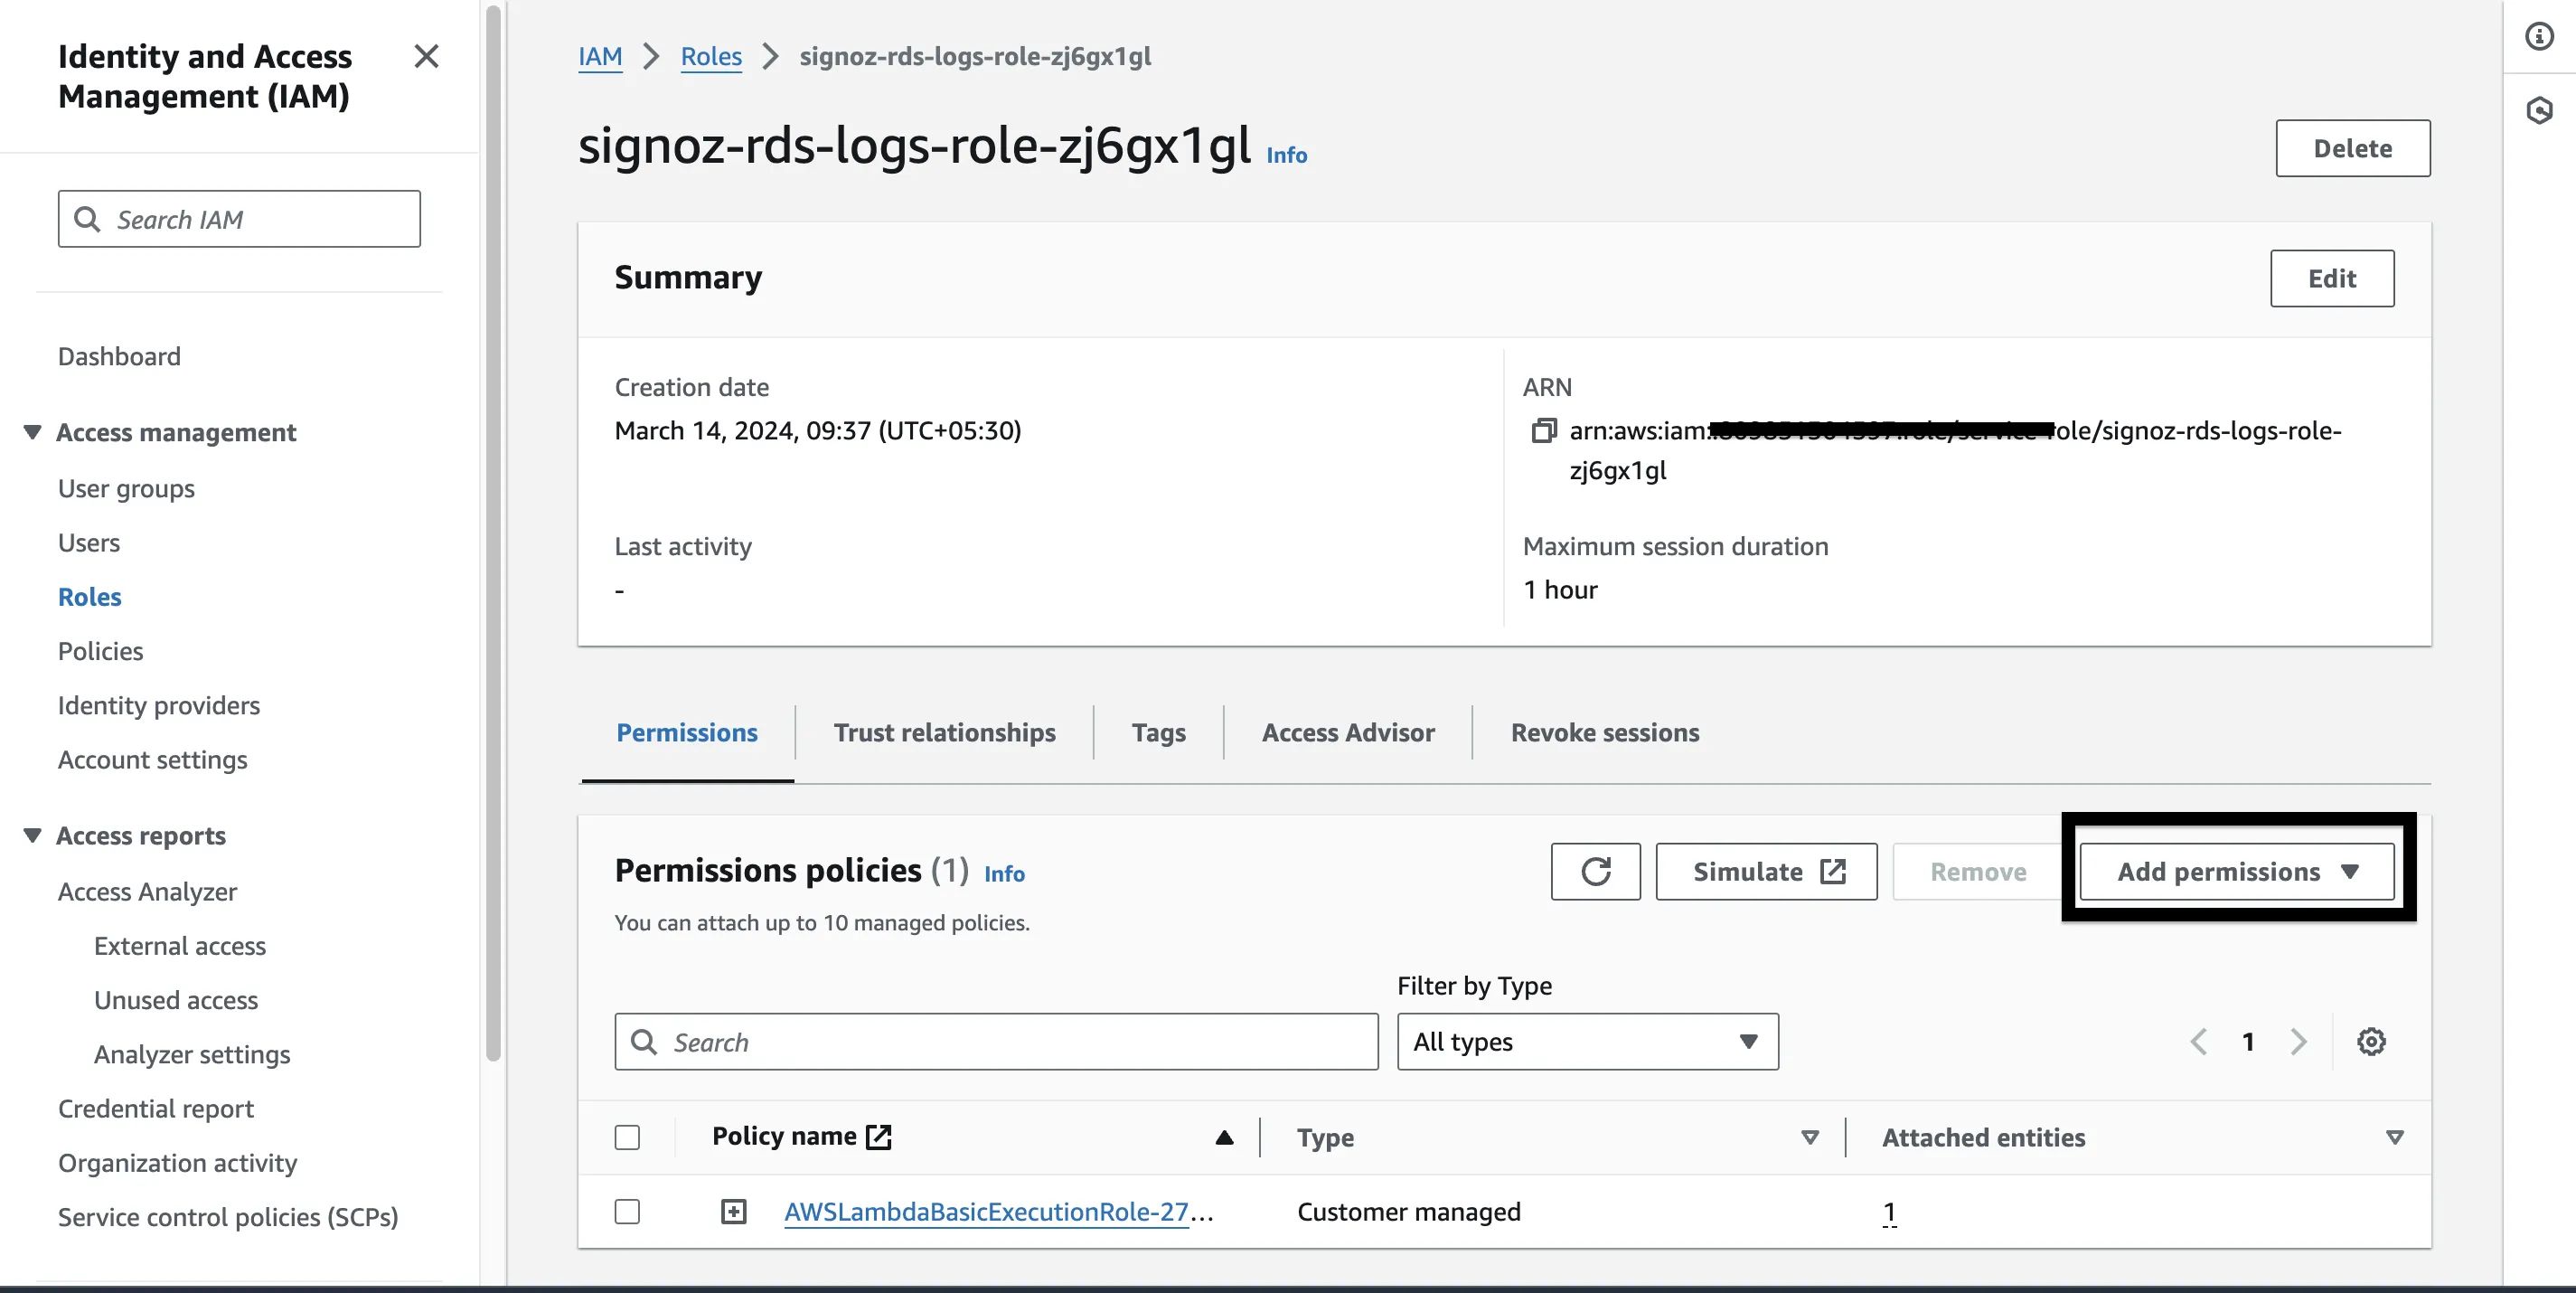
Step 3: Search “S3” and you’ll a policy named AmazonS3FullAccess select that and proceed.

It's advisable to proceed with caution when granting full S3 access, particularly in a production environment. Before deploying your Lambda function with such extensive permissions, it's essential to consult with your system administrator or designated authority to ensure compliance with security protocols and best practices. This step helps mitigate potential risks and ensures that access permissions align with organizational guidelines and requirements.
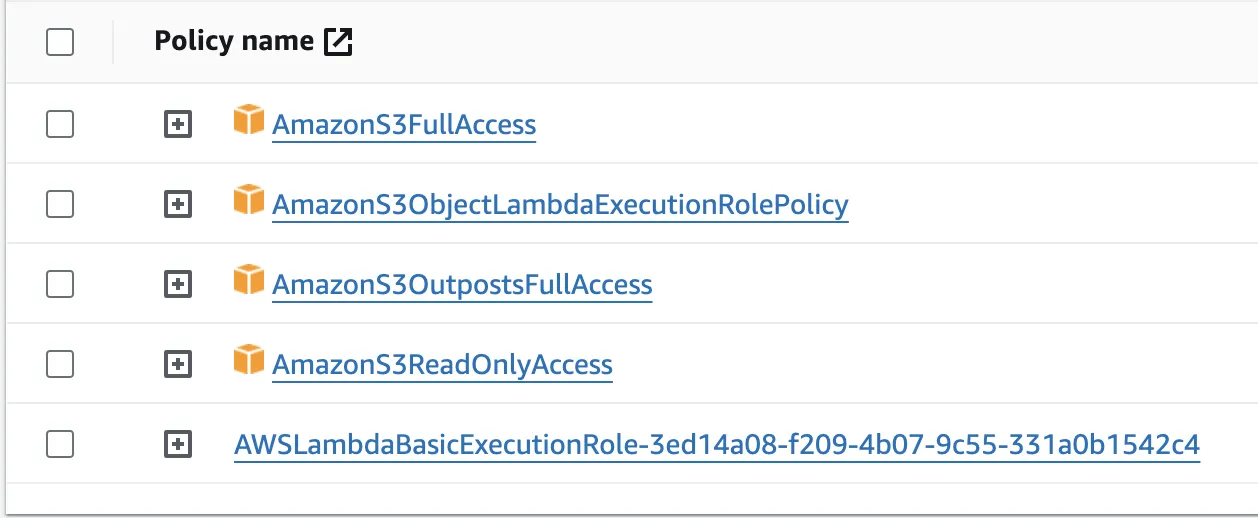
Please refer to the image above as a comprehensive guide to the policy names that you may consider adding to your Lambda function. Failure to include these policies could result in insufficient privileges, potentially hindering the function's ability to perform necessary operations within the AWS environment.
Congrats, you are just done with one of the major hurdle in running your code. Now, let’s add a trigger.
Adding Triggers
You need to use the Lambda console to build a trigger so that your function can be called immediately by another AWS service (S3, in our case). A trigger is a resource you set up to enable your function to be called by another AWS service upon the occurrence of specific events or conditions.
A function may have more than one trigger. Every trigger functions as a client, independently calling your method, and Lambda transfers data from a single trigger to each event it passes to your function.
To setup the trigger, follow these steps:
Step 1: Click on the + Add trigger button from the Lambda console.
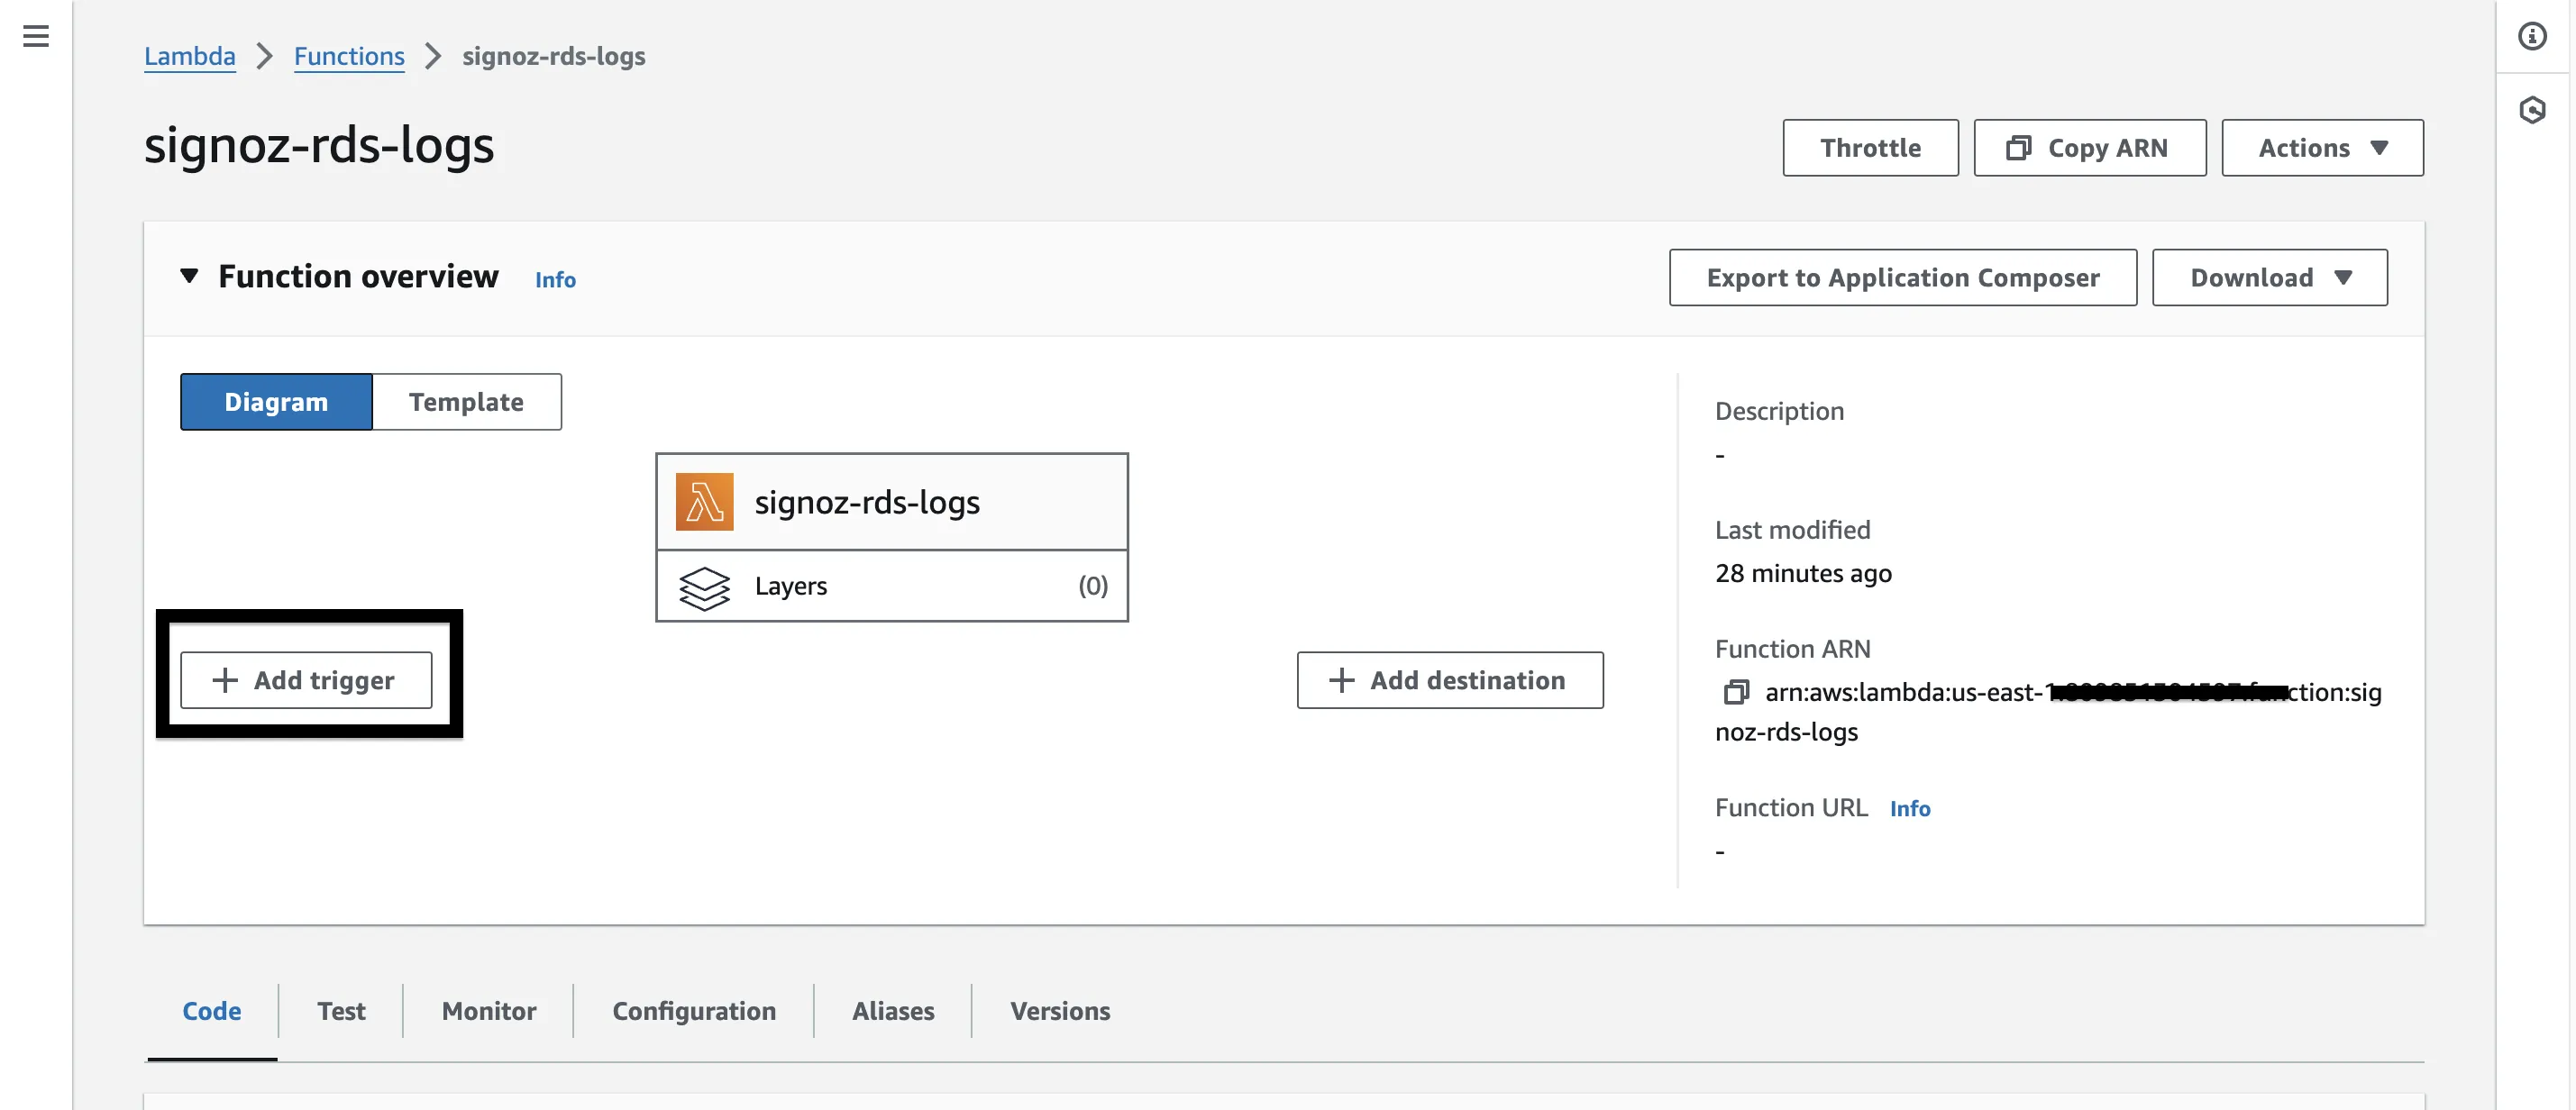
Step 2: Select S3 from the first drop down of AWS services list. Pick your S3 bucket for the second field.
Step 3: For the Event types field, you can select any number of options you wish. The trigger will occur depending upon what option(s) you choose here. By default, the All object create events will be selected.
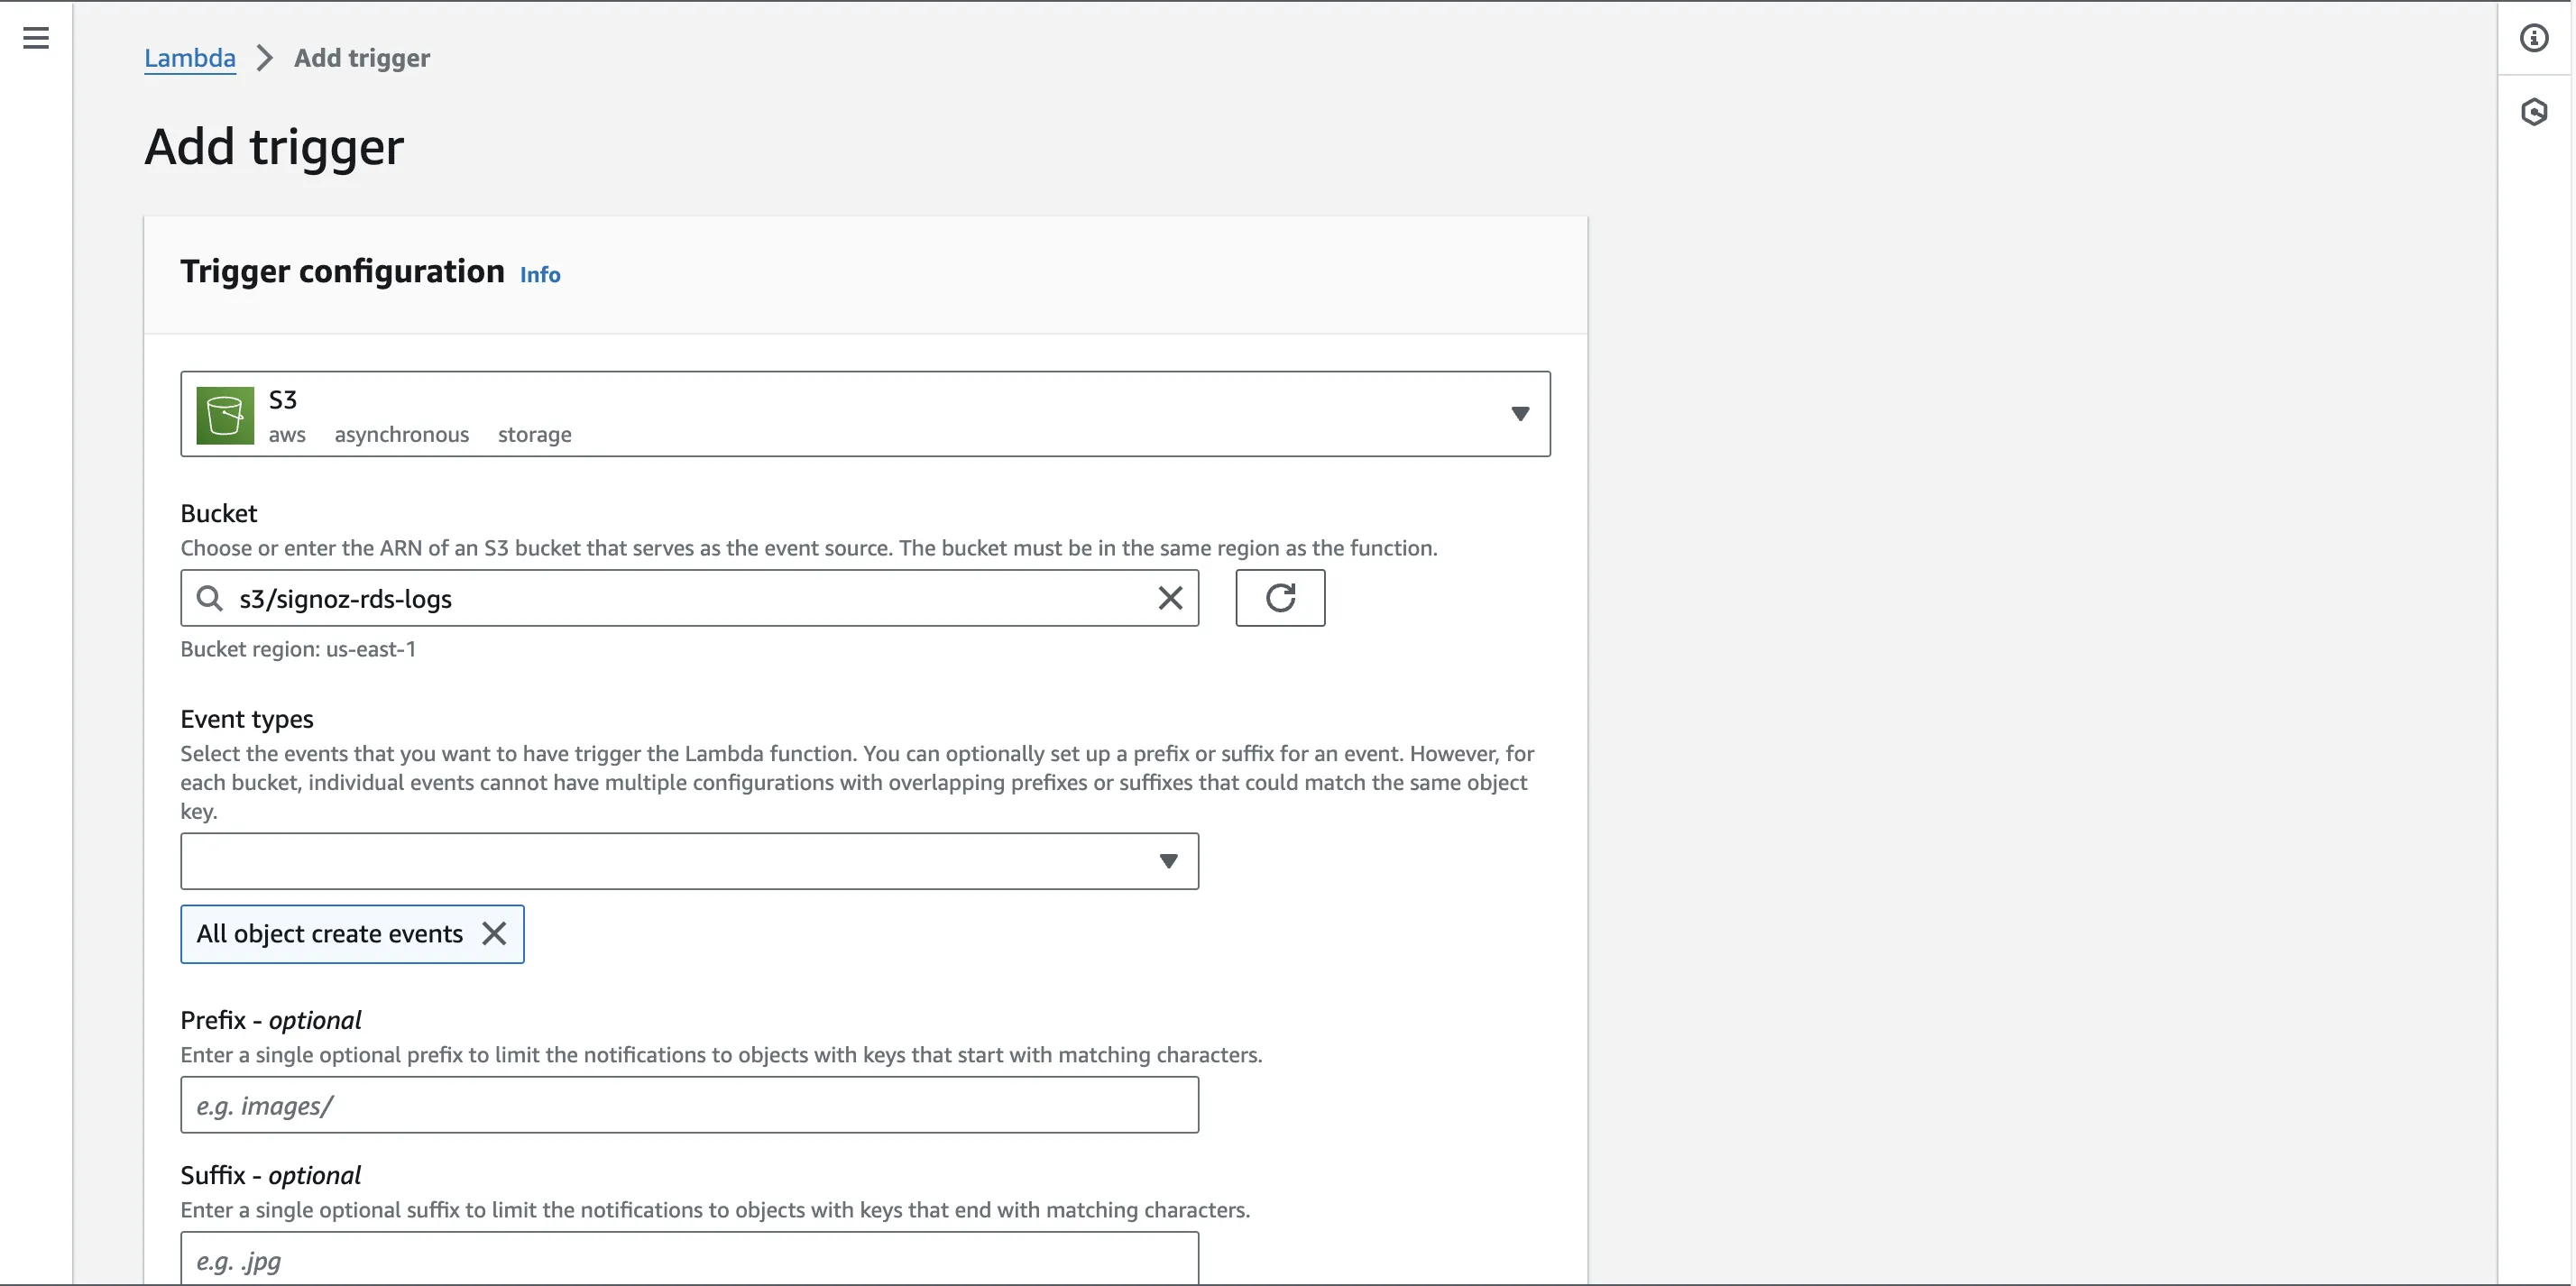
Verify the settings and click on Add button at bottom right to add this trigger.
Adding Request Layer
We will be using python's request module which is not included by default in Lambda.
To utilize Python's requests module within a Lambda function, it's necessary to explicitly add it as a layer. While there may be alternative approaches, it's advisable to adhere to established practices that have been thoroughly tested and proven effective. Therefore, we will proceed with adding requests as a layer to ensure reliable functionality within the Lambda environment.
Step 1: Follow the steps below to create a zip of the request module and add it as a layer to make it work on AWS lambda.
The commands you’d need:
# make a new directory
mkdir python
# move into that directory
cd python

# install requests module
pip install --target . requests
# zip the contents under the name dependencies.zip
zip -r dependencies.zip ../python
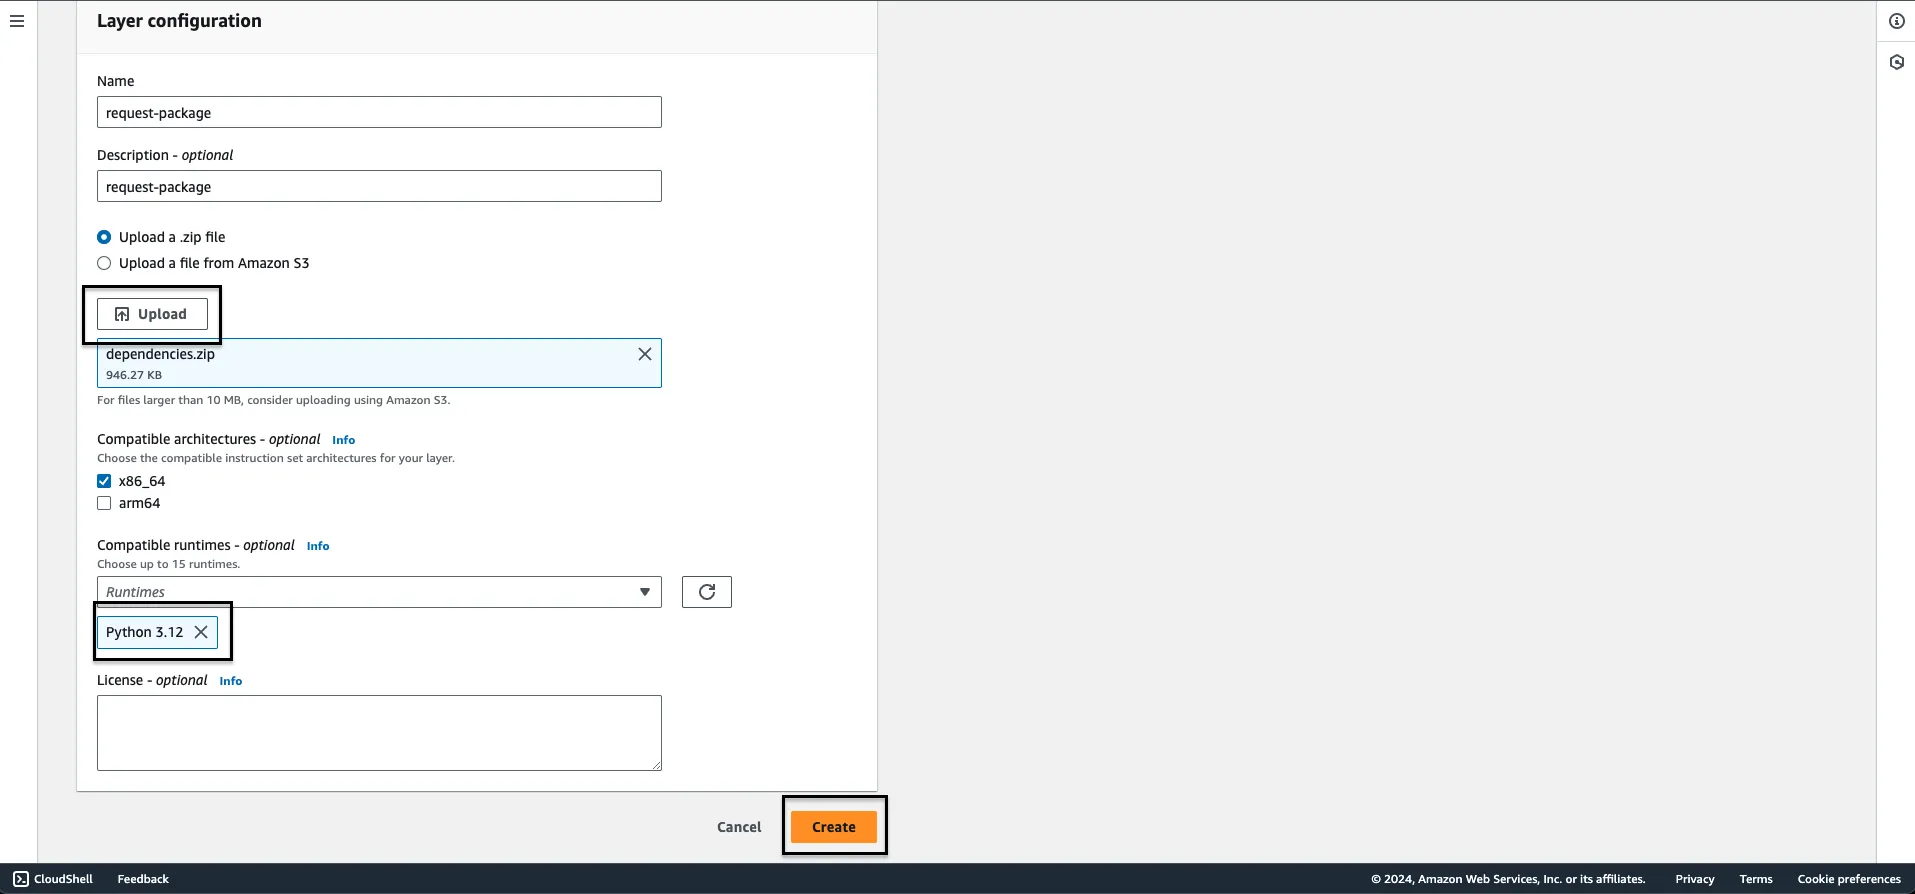
Step 2: To upload your zip file, go to AWS Lambda > Layers and click on Create Layer. [Not inside your specific Lambda function, just the landing page of AWS Lambda].

Step 3: You’ll be redirected to Layer configurations page, here, give a name to your layer, an optional description, select Upload a .zip file , click on Upload and locate the requirements.zip file.
Step 4: Select your desired architecture and pick Python 3.x as your runtime. Hit Create. Your layer has now been created. Now lets connect it to our Lambda function which we created to send logs to SigNoz.
Step 5: Go to your Lambda function, scroll down to Layers section and on the right of it, you’ll find a button that says Add a layer to click on.

Step 6: Pick Custom layers from the checkbox and select your custom layer from the given drop down below and then click on the button Add.
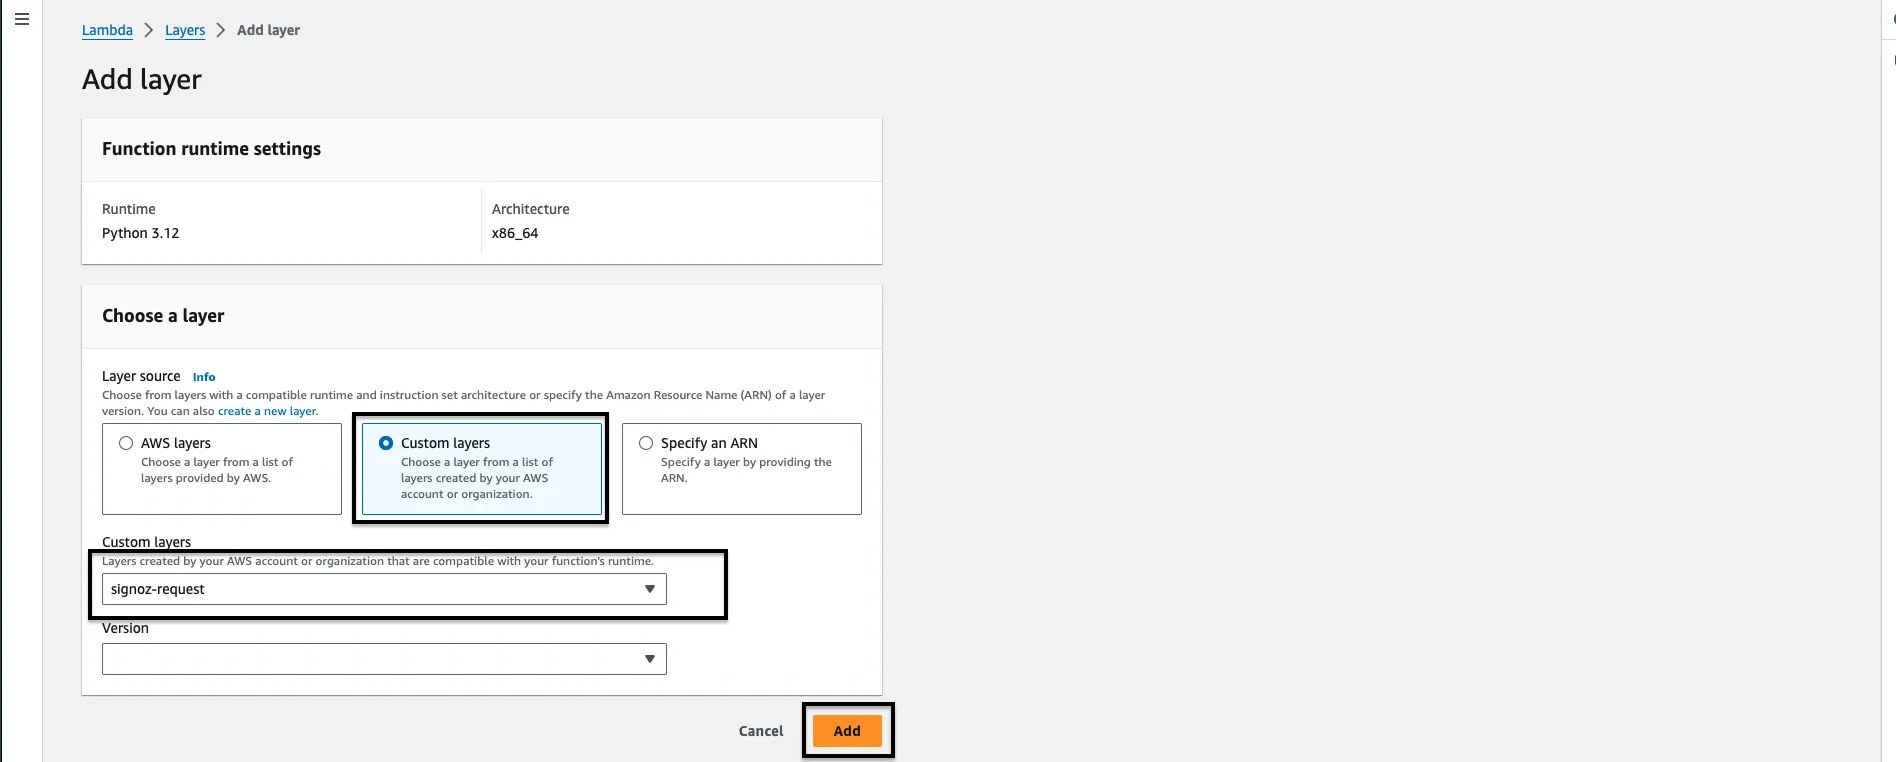
Congratulations, the requests module has been successfully integrated into your code area. By adding this layer, you have resolved the 'request module not found error' that would have otherwise occurred.
The Lambda Function
Now, we come to the pivotal section of this document: the code implementation.
The Python script's primary function revolves around retrieving gzipped log files stored within an Amazon S3 bucket. Subsequently, it decompresses these files, transforms individual log entries into JSON objects, and transmits the resultant JSON data to a predetermined HTTP endpoint.
Below is the comprehensive code along with detailed comments for clarity:
The below code assumes your log files are already in compressed form, if they are not, feel free to remove the decompressing of log files and match the file type you have for you logs (if not already .log).
import json
import gzip
import boto3
import requests
import shlex

# Create an S3 client
s3 = boto3.client('s3')

# Function to convert a log line into a JSON object
def convert_log_line_to_json(line):
    # Define the headers to be used for the JSON keys
    postgres_headers = ["timestamp", "user", "dbname", "pid", "remote_host", "remote_port", "session_id", "line_num", "ps", "session_start", "vxid", "txid", "error_severity", "state_code", "message", "detail", "hint", "internal_query", "internal_position", "context", "statement", "cursor_position", "func_name", "file_name", "file_line_num", "application_name", "backend_type", "leader_pid", "query_id"]

    # Split the log line using shell-like syntax (keeping quotes, etc.)
    res = shlex.split(line, posix=False)

    # Create a dictionary by zipping headers and log line parts
    return dict(zip(postgres_headers, res))

# Lambda function handler
def lambda_handler(event, context):
    # S3 bucket name
    bucket_name = '<name_of_your_bucket>'

    # List all objects in the specified S3 bucket
    response = s3.list_objects_v2(Bucket=bucket_name)

    # Iterate through each object in the bucket
    for obj in response['Contents']:
        # Check if the object is a gzipped log file
        if obj['Key'].endswith('.log.gz'):
            file_key = obj['Key']

            # Download the gzipped file content
            file_obj = s3.get_object(Bucket=bucket_name, Key=file_key)
            file_content = file_obj['Body'].read()

            # Decompress the gzipped content
            decompressed_content = gzip.decompress(file_content)

            # Convert bytes to string
            json_data = str(decompressed_content, encoding='utf-8')

            # Split the string into lines
            lines = json_data.strip().split('\n')

            # Convert the list of strings into a JSON-formatted string
            result = json.dumps(lines, indent=2)

            # Load the JSON-formatted string into a list of strings
            list_of_strings = json.loads(result)

            # Convert each log line string into a JSON object
            json_data = [convert_log_line_to_json(line) for line in list_of_strings]

            req_headers = {
                     'signoz-ingestion-key': '<SIGNOZ_INGESTION_KEY>',
                     'Content-Type': 'application/json'
                }
            # Specify the HTTP endpoint for sending the data
            http_url = 'https://ingest.in.signoz.cloud:443/logs/json'  # Replace with your actual URL

            # Send the JSON data to the specified HTTP endpoint
            response = requests.post(http_url, json=json_data, headers=req_headers)

            # Print information about the sent data and the response received
            print(f"Sent data to {http_url}. Response: {response.status_code}")
Here’s how a raw, unprocessed Postgres RDS log line looks like:
2017-06-12 19:09:49 UTC:...:rds_test@postgres:[11701]:LOG: AUDIT: OBJECT,1,1,READ,SELECT,TABLE,public.t1,select * from t1;
In the code, each field corresponds to a header. The purpose of the code above is to transmit the logs to the SigNoz endpoint. Here, we have used postgres_headers, feel free to change that to any other RDS Database header format as described in the start of this document.
The provided code is functional, but exercise caution when copying and pasting it in its entirety. Incorrect configuration could result in the unintentional ingestion of a large volume of data. If you have limited you log collection or configured it to collect less information, make the suitable changes to the headers as well to match the correct log values.
Other than the above explanation and the code comments, in a nutshell, what the this code does is:
Sends the parsable content of ENTIRE S3 bucket whenever the lambda function gets triggered. It gets triggered by the condition you set above. Let’s mention that again here.
Step 3: For the Event types field, you can select any number of options you wish. The trigger will occur depending upon what option(s) you choose here. By default, the
All object create eventswill be selected.
Lets say you add something to your S3 bucket, it may / may not trigger this lambda function or if you have setup your s3 as if it automatically stores all your RDS logs, segregated in different folders, so whenever any new log gets added, the function will get triggered and send all the S3 data.
This is obviously not what everyone expects, ideal case would be to have a mass log transfer once the first connection is made to SigNoz otel-collector (which then they later get stored in gp2/gp3 storageClass of EBS), and then send logs lines of only the recently logged one.
To achieve this functionality, you need to add few conditions to the code.
- Assuming all standard log lines have a timestamp field.
- Parse and select the timestamp field from the log line and add it before the
response = requests.post(http_url, json=json_data)line as a if else condition to only send logs which are x days older (say 3 days).
So, the function now will first check the log timestamp and only send those logs which are 3 days older (say) or even a few hours old.
Let’s consider the below pseudo code for better understanding:
   from datetime import datetime, timedelta

   # Your given timestamp
   given_timestamp_str = "2024-01-01T23:58:02.231919Z"
   given_timestamp = datetime.fromisoformat(given_timestamp_str.replace('Z', '+00:00'))

   # Current time
   current_time = datetime.utcnow()

   # Calculate the time difference
   time_difference = current_time - given_timestamp

   # Check if the time difference is less than 3 days
   if time_difference < timedelta(days=3):
       # Run your specific function here
       print("Running the specific function.")
   # ADD THE response = requests.post(http_url, json=json_data) LINE HERE

   else:
       print("Time difference exceeds 3 days. Function will not run.")
Feel free to modify any part of the code according to your requirements.
Running the code locally.
If you want to run the entire setup locally in your laptop for testing purposes. Here’s the reference code for you:
import os
import gzip
import json
import requests
import shlex

def convert_log_line_to_json(line):
    postgres_headers = ["timestamp", "user", "dbname", "pid", "remote_host", "remote_port", "session_id", "line_num", "ps", "session_start", "vxid", "txid", "error_severity", "state_code", "message", "detail", "hint", "internal_query", "internal_position", "context", "statement", "cursor_position", "func_name", "file_name", "file_line_num", "application_name", "backend_type", "leader_pid", "query_id"]
    res = shlex.split(line, posix = False)
    return dict(zip(headers, res))

def process_log_file(file_path):
    with gzip.open(file_path, 'r') as f:
        log_data = f.read().decode('utf-8')
        lines = log_data.strip().split('\n')
        result = json.dumps(lines, indent=2)
        list_of_strings = json.loads(result)
        json_data = [convert_log_line_to_json(line) for line in list_of_strings]
        req_headers = {
                     'signoz-ingestion-key': '<SIGNOZ_INGESTION_KEY>',
                     'Content-Type': 'application/json'
                }
        http_url = 'https://ingest.in.signoz.cloud:443/logs/json'  # Replace with your actual URL
        response = requests.post(http_url, json=json_data, headers=req_headers)

def main():
    root_folder = '<folder_name>'

    for root, _, files in os.walk(root_folder):
        for file in files:
            if file.endswith('.log.gz'):
                file_path = os.path.join(root, file)
                process_log_file(file_path)

if __name__ == '__main__':
    main()
To incorporate log files into the folder, including nested directories, the code systematically examines all sub-folders to identify files ending with the .log.gz extension. Should you wish to target different file types, you have the flexibility to modify the code accordingly.
Testing your Lambda function
Once you've finished writing your code, it's crucial to deploy it and conduct thorough testing to ensure its functionality. Before proceeding with deployment and testing, it's important to consider adjusting the timeout setting for your Lambda function. This adjustment is necessary because the process of transferring data from S3 to an external endpoint may take several minutes, exceeding the default Lambda timeout of 3 seconds.
To extend the timeout duration, follow these steps:
- Navigate to the Lambda function configuration.
- Access the "General Configuration" section.
- Click on the "Edit" button to modify settings.
- Increase the timeout value to a duration exceeding 10 minutes. Typically, the code execution completes within 1-4 minutes at most.
By adjusting the timeout setting, you ensure that your Lambda function has sufficient time to complete the data transfer process without encountering timeouts. This proactive measure enhances the reliability and effectiveness of your deployed solution.

Once you've finished adjusting the timeout setting, navigate to the code editor for your Lambda function. Locate the 'test' button, and from the dropdown menu, select the option labeled 'Configure test events.' Create a new test case by specifying it as an S3 PUT event, then save your configuration.
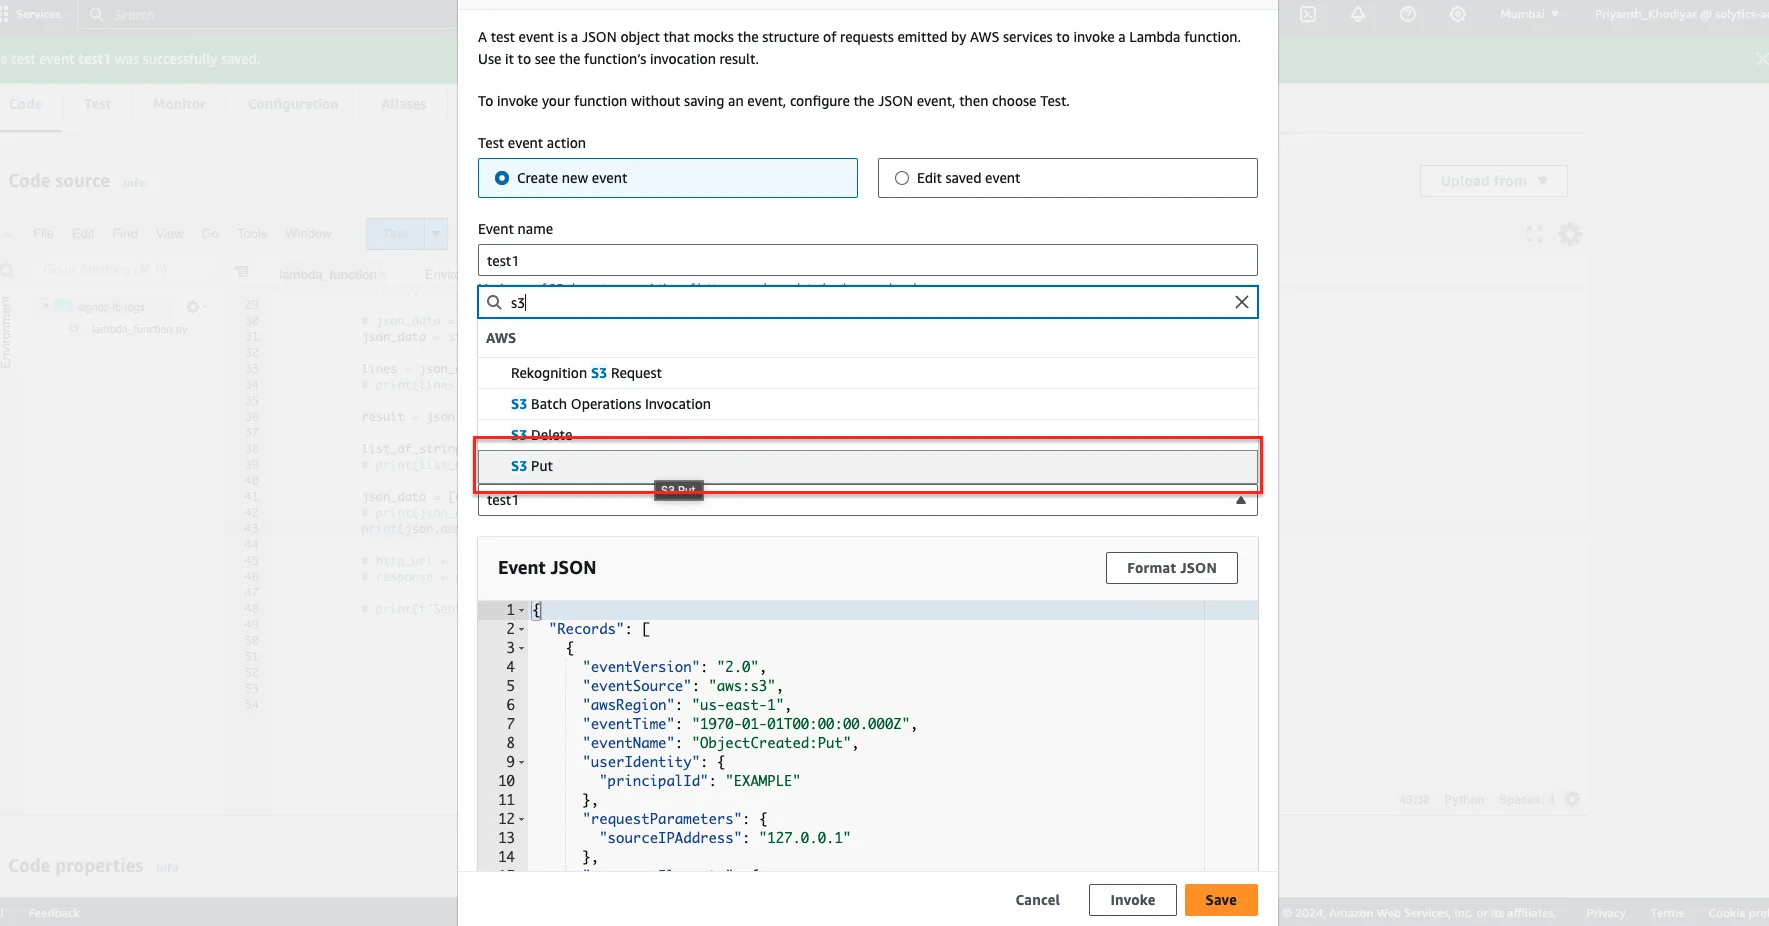
You're now prepared to proceed. Whenever you make alterations to the code and wish to evaluate them, follow these steps: Deploy the code first (equivalent to pressing 'Save'), and once it's fully deployed, proceed to click on the 'Test' button.
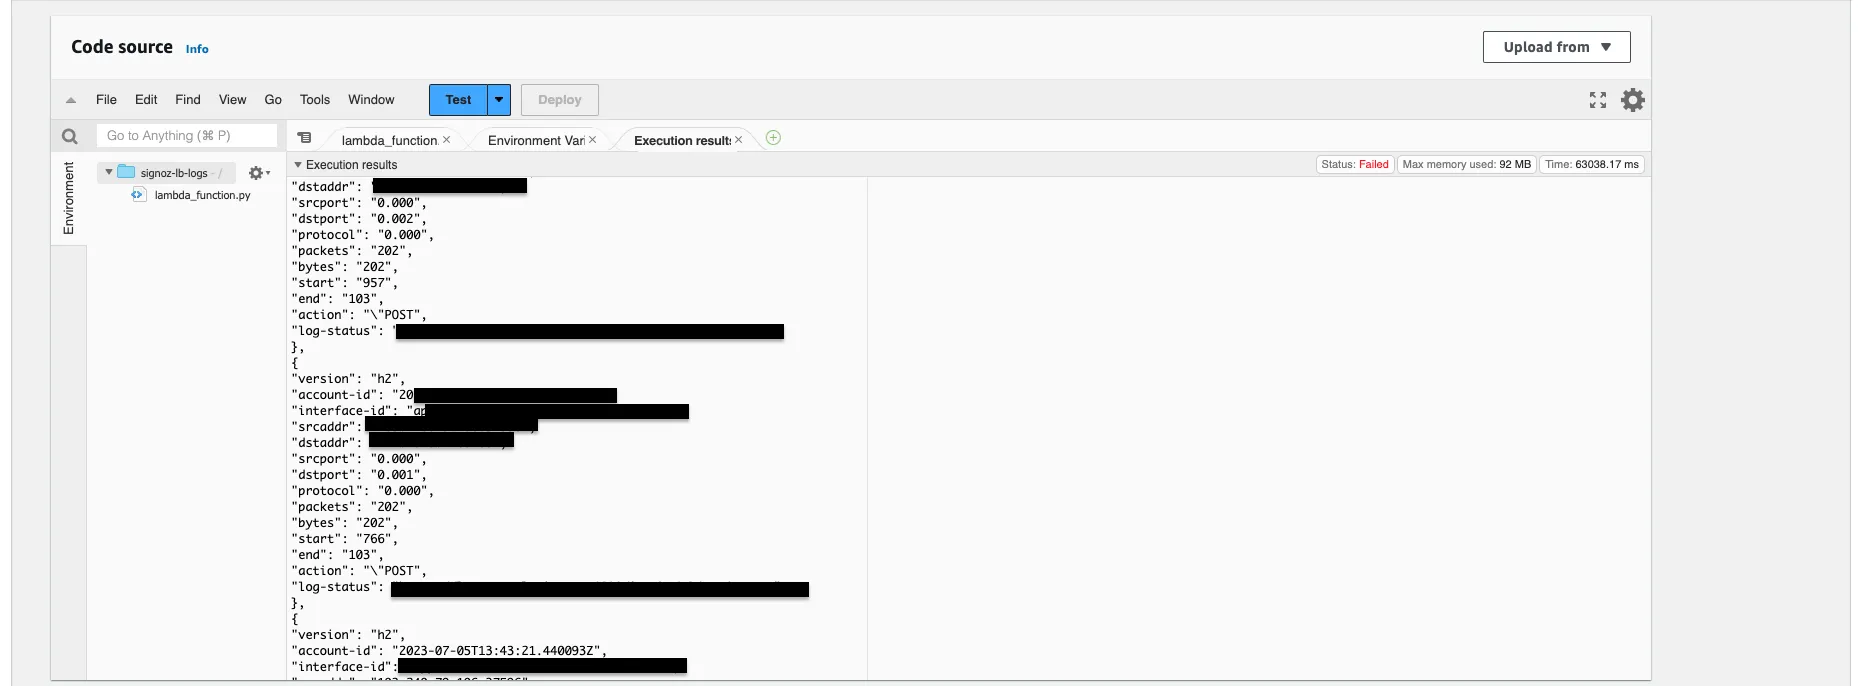
Below is an image showing the process of transmitting the RDS logs to the SigNoz endpoint.
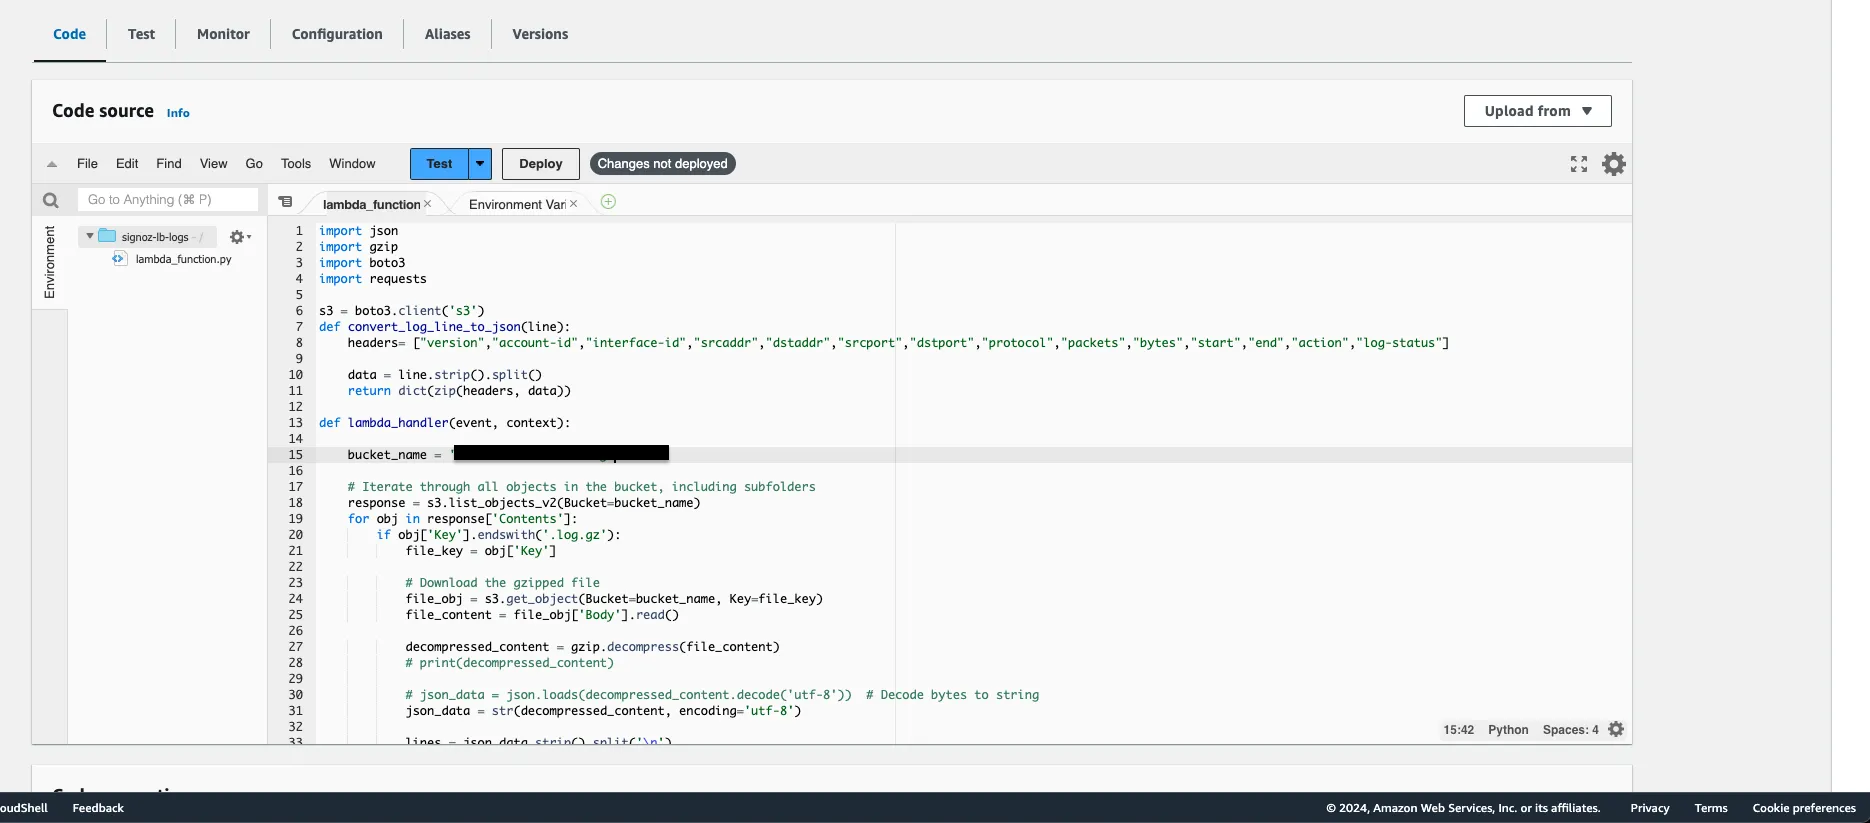
Test Case and Output
If the logs are sent successfully, here's how they'll be transmitted. The following output displays the JSON-formatted data as we've printed it to visualize the sent information.
Visualize the logs in SigNoz
Upon accessing the SigNoz logs section, you will notice a considerable influx of logs. You have the option to seamlessly transition to live monitoring of logs as well. Simply click on any log line to view its detailed information.

